
Table of Content
It’s no secret that software quality managers face increasing pressure to deliver high-quality software at record-breaking speed. Time-to-market is a pretty straightforward calculation, but how precisely can we measure success when it comes to quality?
What You’ll Learn
- The importance of Key Performance Indicators (KPIs) in software testing and quality management.
- Eight specific KPIs that are crucial for mitigating release risk, improving quality, and evaluating testing success.
- How to calculate and track the Defect Detection Effectiveness (DDE) to measure the effectiveness of regression testing.
- The significance of tracking System-Wide Defects (SWD) and the impact of defects on the overall system.
- The role of Requirements Completion and Development Completion in understanding project risk and ensuring quality.
Delivering high-quality software depends on a multitude of factors, such as project methodology (waterfall, hybrid, agile), software complexity, the level of technical debt, the number of interfaces, and much more. The number of variables at play should not be underestimated. Moreover, survival in the marketplace demands continuous evolution – both in our perspectives and in our measuring sticks.
We’ve come up with 8 software testing KPIs that you should add to your quality scorecard. Start tracking them today to mitigate release risk, improve quality and evaluate your success.

Defect Detection Effectiveness (DDE, AKA Defect Detection Percentage)
Overall regression testing effectiveness, or DDE, is calculated as a ratio of defects found prior to and after release. The latter are typically known as “incidents” and logged in a helpdesk system, whereas defects found during testing phases (e.g., unit, system, regression, or UAT testing) are documented with tools like Panaya Test Dynamix.
Calculating the DDE software testing KPI
To properly track this KPI, always be sure that each defect is identified with the correct software version before release into the production environment. The formula for calculating DDE is:
Number of defects identified in the last software version testing/
Number of Defects Identified at Software Version Release + Escaped defects identified by end-users (e.g., incidents)
Here’s a simple illustration:
Let’s assume 95 defects were found during your regression testing cycle on the last monthly SAP Service Pack, and 25 defects were logged after the release. The DDE would be 79%, calculated as 95 divided by (95 + 25).
The DDE starts at 100% the day after production release. Since your internal end-users and customers begin working with the latest SAP Service Pack, as in our example, they will inevitably log a few incidents. We’ll often see a “feeding frenzy” within the first week, starting two days after a Service Pack hits the productive environment. That’s when you’ll notice a quick drop to about 95%.
If your company is on a monthly Service Pack release schedule, then measure DDE for a 30-day period for each Service Pack. On the other hand, if your company is only running four major release cycles per year, it’s best to track the DDE trend for 90 days.
————
You might also like our blog
Optimize Quality and Value Using the Software Testing Life Cycle
————
What is considered a “good DDE”? Industry experts and thought leaders often say that 90% is commendable in most cases, but every organization also evolves over time. Some organizations consistently achieve a DDE of over 95% by shifting left with change impact simulation tools, such as Panaya’s Impact Analysis.
System-Wide Defects (SWD)
Do you ever encounter multiple defects associated with the same objects? Sure, you do; it’s a common phenomenon during test management. It is often behind a sudden, extensive uptick in the number of bugs reported in a UAT cycle.
So, what are your options to manage this inevitable “defect inflation”?
It’s simple. Begin tracking the connections between defects to understand why the bug trend line moves upward toward the end of a testing cycle rather than down.

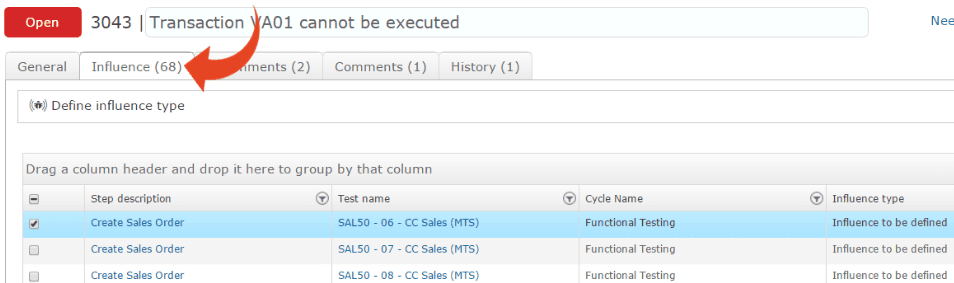
Unfortunately, manual tracking takes a lot of time and can be painstaking work with legacy ALM tools, which only give you the ability to link defects to one another and add a comment. If you don’t have a choice of tools, you’ll need to set aside the time to properly track the data and then calculate what we call “System-Wide Defects.” With Panaya Test Dynamix, defect tracking and analysis are built into the engine itself so that you can calculate SWD at the click of a button.
Requirements Completion
Quality managers need to understand risk at a deeper level, with visibility into the connections between the code, transport layers, and end-user requirements. This requires the right set of tools. Panaya Release Dynamix (RDx) is unique in providing that kind of insight to organizations running SAP solutions, with intelligent suggestions for unit tests and risk analysis based on transport activity.
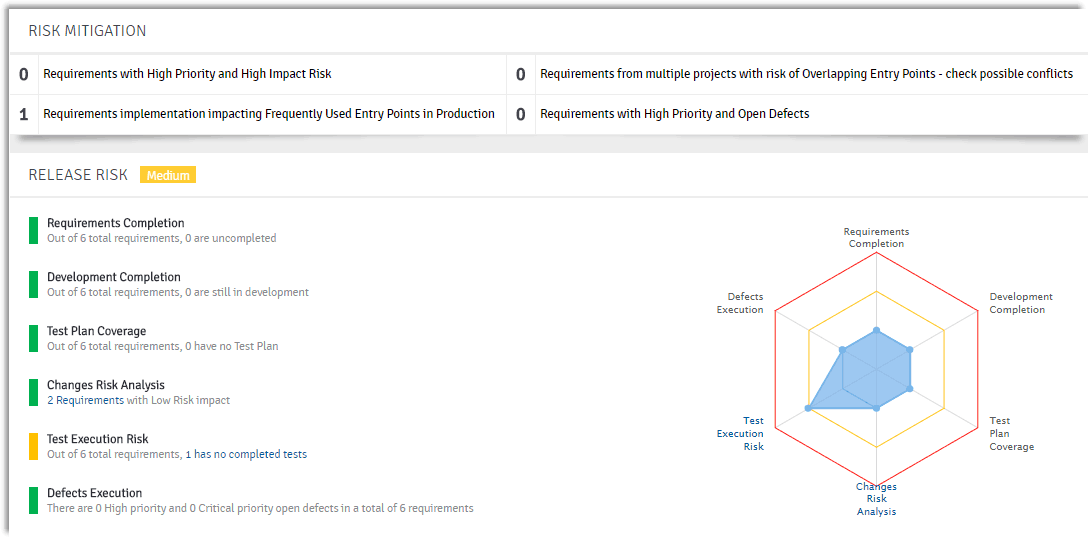
Development Completion
We live in the age of the customer, which is shaping every organization’s digital transformation strategy. Part of this is the understanding that the traditional ALM models of yesteryear are not well designed for the continuous delivery model prevalent today. In this day and age, we can’t afford to be siloed in our thinking or our organizational approach to software quality assurance and delivery.
That means QA and testing managers must embed themselves within the application development process – and that means having a finger on the pulse of real-world user stories. It’s not enough to sit and wait for a scenario to reach its end status and then react to the outcome. We must follow its evolution, attend daily Scrum meetings, and talk openly about the risks arising due to significant changes made to the application being tested.
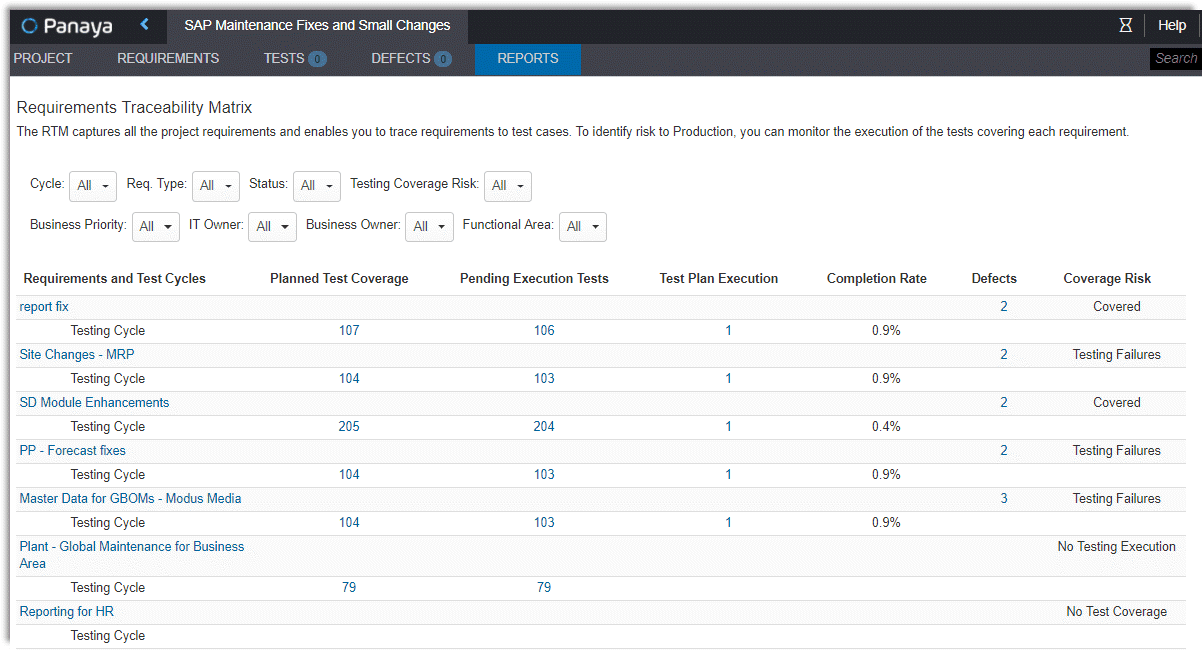
Test Plan Coverage
The Test Plan Coverage is a great KPI to track because it expands your vision beyond system, integration, regression, and UAT coverage. In the true spirit of shifting-left, it recognizes the rising importance of tracking unit testing coverage. Sounds crazy, right? It’s not – especially if you have the right tools to make the execution of unit tests easy and capturing the actual results (evidence) even easier. (Learn about what software testing life cycle is.) Unit testing increases dramatically with Panaya Test Dynamix’s built-in test record-and-play capability. The Requirements Traceability Matrix showcases end-to-end coverage of actual results from unit-level through regression testing.
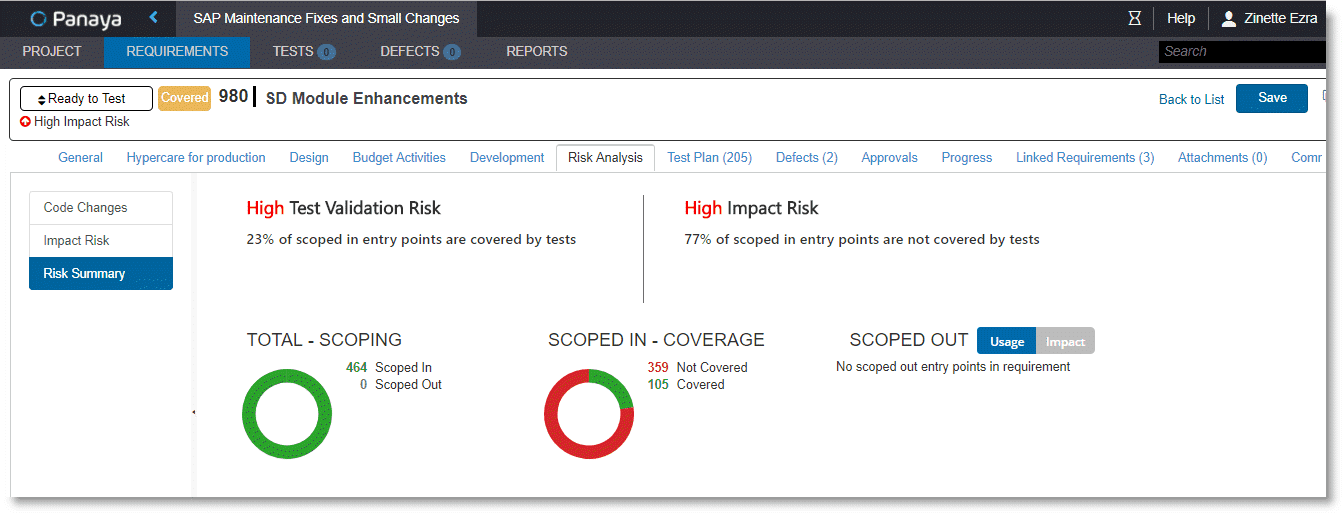
Change Risk Analysis
Risk is inherent to any change. At the same time, many organizations have their own definition of what ‘change risk’ means to them, and it can be unclear if we are testing the right things to mitigate that risk. You need to systematically identify, calculate and track the changing risk and how it will affect your project. Panaya’s Release Dynamix (RDx) solution will take the guesswork out of this impact analysis, keeping you aware of how the risk is changing as you move through the delivery lifecycle.
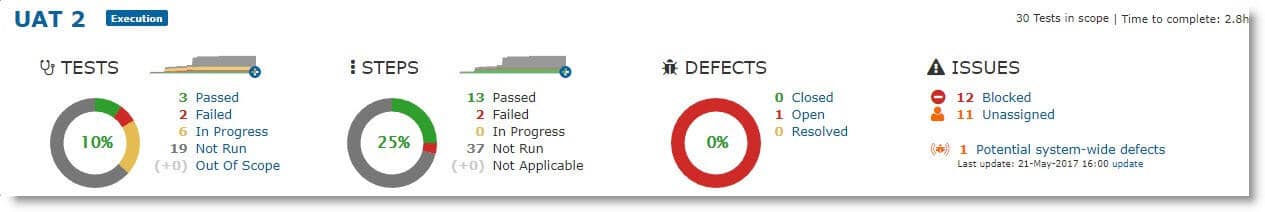
Test Execution Risk
It’s common for organizations to track KPIs like authored tests, passed tests, automated tests, and tests executed, but what about the actual steps within each test? It makes sense to track test execution progress and status at the business process level when you have many different hand-offs across a UAT cycle. Many of the popular ALM platforms fail to provide out-of-the-box reporting capabilities to track test ‘step’ execution progress. When you have many different ‘hand-offs’ occurring across a UAT cycle, it makes sense to track Test Execution Risk and status, not only at the test-level, but also at the business process level. Panaya Test Dynamix does just that, out-of-the-box.
Key Takeaways
- Learn how to measure the ratio of defects found before and after release, aiming for a high Defect Detection Effectiveness (DDE) percentage to ensure software quality.
- Understand the importance of tracking System-Wide Defects (SWD) defects to manage and mitigate defect inflation during testing cycles.
- Gain insights into the necessity of visibility into code, transport layers, and end-user requirements to understand project risk better.
- Emphasize the need for QA and testing managers to be embedded within the development process to monitor real-world user stories and risks.
- Realize the value of tracking unit testing coverage and capturing actual results to ensure comprehensive testing.
Conclusion
Panaya’s platform provides the tools and capabilities to keep track of all of the 8 KPIs we’ve discussed, providing maximum insight into how your software testing impacts product quality. That means software quality managers can meet their KPI goals and drive more innovation while reducing effort by 30-50% without compromising scope or quality.
When you standardize your testing processes and track performance intelligently, you can truly measure success and gain real-time visibility into all your test cycles and eliminate that unnecessary stress (yeah, it’s really not healthy).