Table of Content

Ifat Chitin Morrison is a Full-Stack Developer in Panaya’s ForeSight group. Ifat has developed exciting features in ForeSight, such as the Impact Analysis Graph and the Salesforce Org Overview, which bring unique value to Panaya’s customers. She joined Panaya 2.5 years ago, and after 13 years as a Back-End Developer, she fell in love with the exciting world of Front-End Development.
A Story of a Salesforce Admin’s 1st Day at Work
Danielle started her new Salesforce Admin position at a new firm – How Exciting!
Her first task was to make a change in one of the Process Builders, a point-and-click tool that lets you easily automate business processes and see a graphical representation of them. It’s a pretty regular task, but after two hours of investigation, Danielle was completely lost! Her new company had a Salesforce org that was quite complex, and she could not figure out the relationships between the different components.
Sound familiar?
Well, it is – this is a very common scenario with Salesforce and represents the double-edged sword that exists in every Salesforce change. Complexity means your organization is innovating, but it also means it is harder to untangle.
On the one hand, in a small org, changes in Salesforce can be done quickly and easily – Great! Companies can change fast. But there is a caveat: It’s easy to make changes, but the changes are not always done properly and can lead to a very cluttered org. To add to that, as companies grow, the businesses demand more frequent changes, and guess what? The org keeps getting more and more complex.
Poor Danielle! Can we help her?
YES!
A Bit About Us:
Panaya ForeSight is a Change Intelligence Platform that enables you to foresee and understand the potential risk and impact of any change you plan to make to your Salesforce systems. Panaya allows you to innovate intelligently, quickly and with no fear.
A Single Graph that Reveals the Complexity within Your Salesforce Org
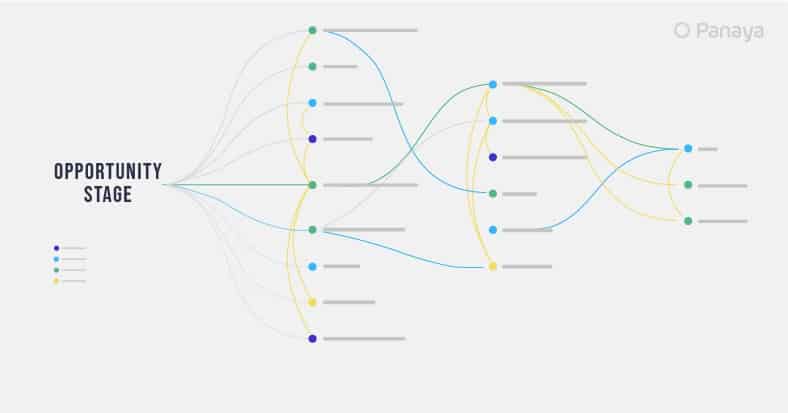
To help Danielle (and any Admin, Salesforce Developer, Architect or Manager) – we developed an Impact Analysis graph that helps her get to know her org quickly and thoroughly.
The Impact Analysis graph is a clear visualization of the dependencies between the components in an org. It reveals even those that you may not have been aware of!
With Panaya ForeSight, Danielle can now make all the right decisions, with full knowledge and visibility of what kind of impact her change will have, the scope of the change she is about to make and what should be tested as a result of this change.
How Our Customers Describe ForeSight
★★★★★
A must have tool for any Org.
“This application is awesome. It saves us a lot of time for any new projects we undertake. Usually, analyzing a component would take days or even weeks to identify all areas it affects. With Panaya it only takes a couple of minutes sometimes in seconds. It provides a clear cut picture for any salesforce component and definitely a must-have for any Org. This is an Admin and Developer’s best friend.”
★★★★★
Best app for your heavily customized org!
“I think this is the most powerful, most useful app we’ve purchased. Just let Panaya know what you are about to change and you’ll get all impacted components right away. Plan your changes and tests in a click of a button. This app saves us hours of investigation efforts before each change and most important- prevent bugs and failures of the system. If your org is heavily customized, this app is a must.”
★★★★★
Great time saving tool
“We’ve had the ForeSight app for a short time but it has already proven its worth by saving us so much time on a weekly basis! The on boarding process was second to none and the level of support we receive couldn’t be more responsive and friendly too. I highly recommend this app.“
Reviews above are from the Salesforce AppExchange. See more here >
Since Danielle discovered Panaya ForeSight, she cannot imagine her work without it. Now when she needs to perform a change to any component, she just picks it as a scoped item and performs an Impact Analysis on it.
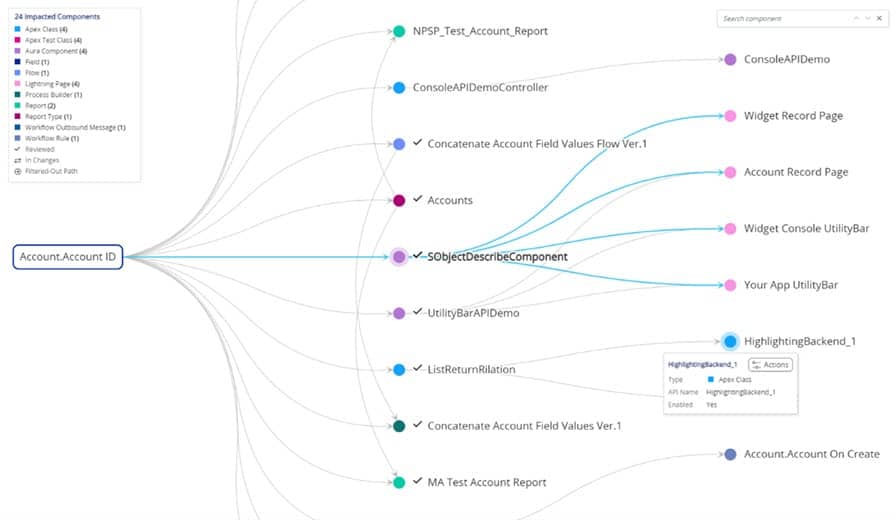
We understand that our customers need a graph that is both visually appealing and interactive, so we developed the Impact Analysis graph as a main working space.
Danielle then uses the graph to understand the impact of her change. The graph shows her all the impacted components. She can zoom in and out to investigate relations. If needed, she uses the node context menu to view the related component in Salesforce or to check its source code to dive in and understand this relationship.
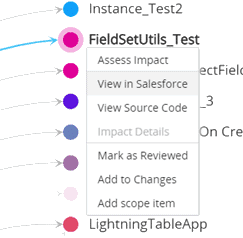
After reviewing it, she marks it as “reviewed”.
Navigating through the graph makes her work as easy as looking at a map.
Filtering the Graph to Zoom in on Complexities
She can then filter out all the reviewed components to narrow down her investigation. If the graph is too big, she can filter out components that are of less interest to her, such as dashboards or reports.
Searching on the Graph to Discover Hidden Dependencies
She also likes to use the graph to learn and get to know the system, since the graph helps her visualize the overall system structure and relationships.
She clicks on a node to highlight its path from the scoped item to this node’s impacted components.
She performs searches in the graph using Ctrl+F and the graph pans to the search results. This way she can inspect parts of the system she is less familiar with, and very quickly become a real champion.
Using Panaya ForeSight she makes all her changes easily and intelligently!
A Message from R&D:
What a journey it has been! As the main developer of this graph, I have so much to share about this journey. How did we end up with this beautiful and easy-to-use graph? How did it all start? What did it look like at the beginning? Which technologies did we use? The client side is written in TypeScript and Angular, using Cytoscape.js, which is a graph library with an amazing API. The server side is written in Java.
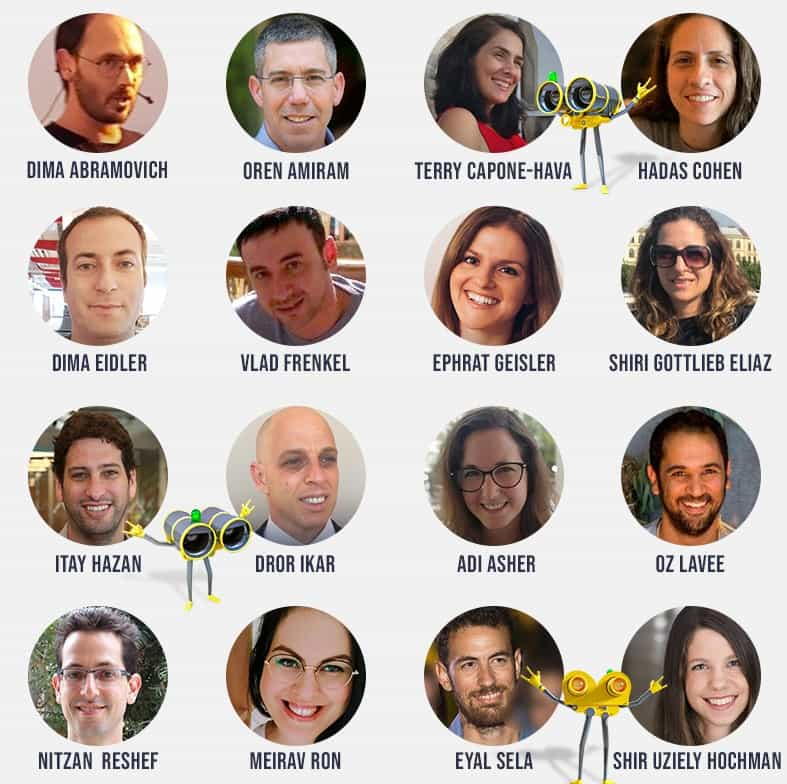
Happy to introduce you to the amazing team who worked on this unique graph!
And thanks to Max Franz who created the library on Cytoscape.js and helped with all our queries.
Interested to hear more about it? I will share all of this in our next article, don’t miss it 😊
Change Intelligence for Salesforce
Check Out AppExchenageWant To Learn More About Panaya ForeSight?
- Start your free trial of ForeSight for Salesforce
- Check out our Resource Center
- Follow us on Linkedin, Twitter, YouTube and Facebook
We’re Hiring!
Apply now on our Career Center