Traditional test management tools make a vast amount of status information available to the project manager. Numbers, charts and dashboards provide information on the project progress. But surprisingly, there is one question, which is probably the most important question when managing a project, that the tools fail to address. The question is “Are we on track?”
In spite of all the information provided by these tools, the answer to this question is generally a guess or a gut feeling, based on the current data and experience from previous projects. Some managers extract the data from the tool, and try to do the forecast in Excel, but this is a tedious and error-prone process.
This lack of an unbiased prediction often leads to over-optimism and to the project being delayed, as described in the attached article: https://www.pmbypm.com/why-optimism-is-bad-for-the-projects
At Panaya we are striving to develop a smart test management tool. We want to provide managers with actionable insights, allowing them to take action long before the situation becomes irreversible.
That’s why we created a built-in report in Panaya that gives our customers a quick answer to the question “Are we on track?”
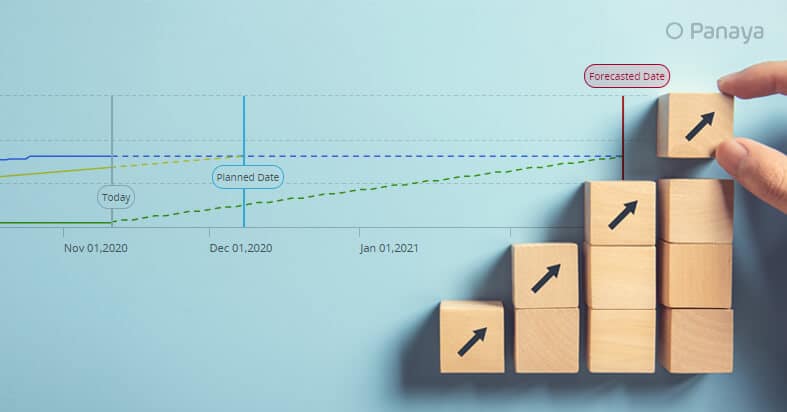
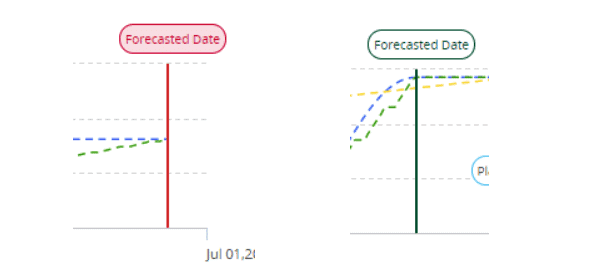
In this report, you can see the forecasted date for project completion.
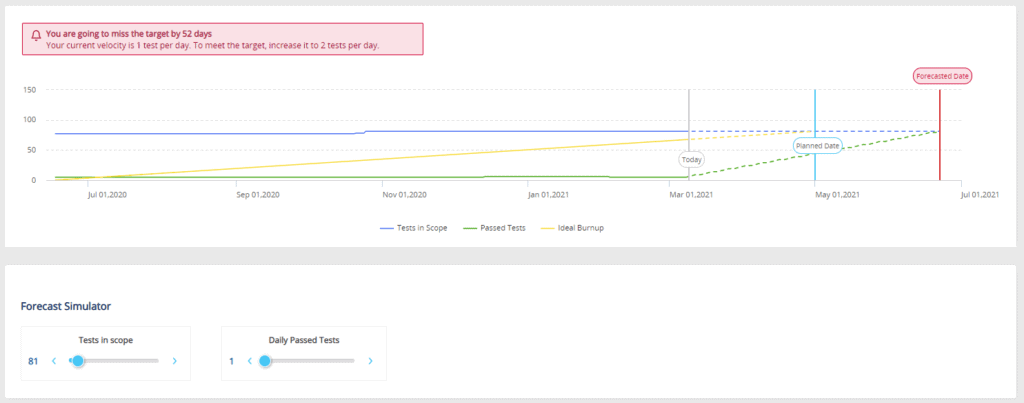
At the top, you can see the clear bottom line “You are going to miss the target in X days”, or “You are Y days ahead of schedule”.
You don’t need any other statistics or to make any other calculations. Panaya does it for you!
The report compares the total number of tests vs the number of tests already passed, and it performs an advanced extrapolation, showing you your expected end date. The data is presented graphically on a timeline:
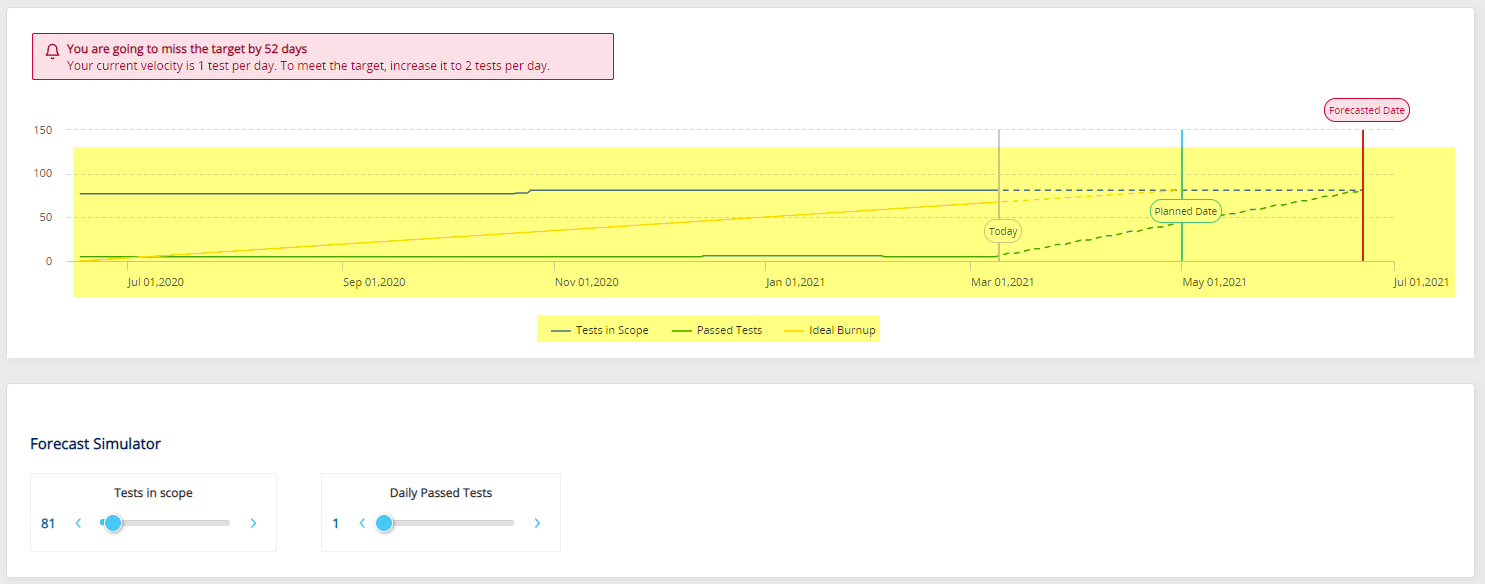
Along the X-axis (the date), there are 3 indicators:
- Today
- Planned End Date
- Forecasted End Date
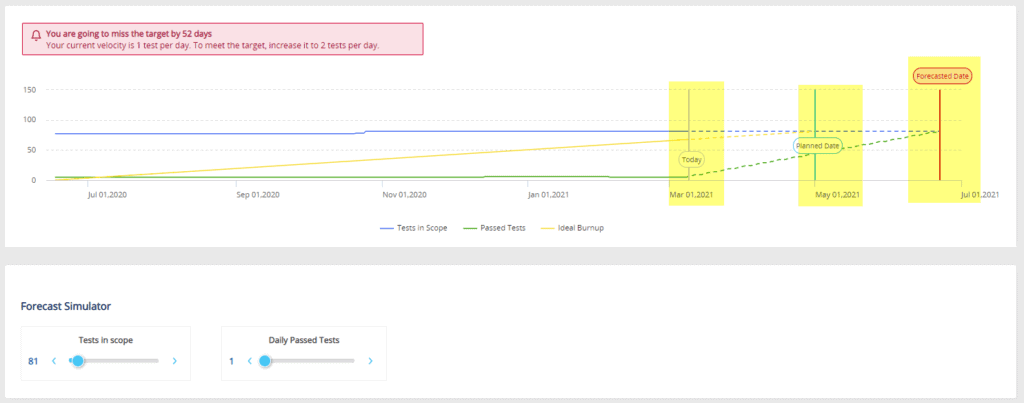
To the left of the “Today” indicator, you can find the actual data. It is being presented by solid lines. The forecasted data is presented to the right of today’s date in dotted lines.
The Planned End Date is set in Panaya by the project manager.
The Forecasted End Date is based on your daily test completion rate in the past period.
If the forecasted end date is after the planned end date, it is displayed in red, to emphasize that an action is needed.
But there’s more! Merely informing you that your project is delayed is not enough. Our goal is to make sure that you can complete your project on time. Therefore, we state clearly what the status of your project is, and tell you explicitly what you need to do in order to complete the project on time:


If you are currently on track to miss the project deadline, you have 3 options to make sure you complete the project on time:
- Increase the speed – Complete more tests every day.
- Decrease the project scope – Reduce the total of test cases you need to perform by removing tests from the test plan.
- Extend the completion date of the project.
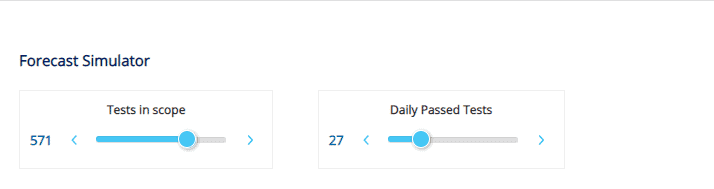
To help you do the “what if” calculation, and to help you reach your goal, Panaya provides you with a simulator.
You can change the number of tests in scope, and/or change the expected daily velocity you plan to reach and see the impact of in real-time these changes in the graph.
You can view the forecast for the whole project, or you can focus on a specific cycle and see its status and forecast.
You can view the graph based on test data, or on steps data.

Future possible enhancements:
- More filters, enabling you to see the status and forecast for a specific group of tests (e.g. you can focus on a specific SAP Module to see its progress and forecast)
- Option to customize the timeline and the resources, e.g. add vacations, holidays, etc.
- Smarter extrapolation based on historical data from completed projects.
- Identify and ignore extreme data points in extrapolation
- Provide answers regarding development as well as testing.
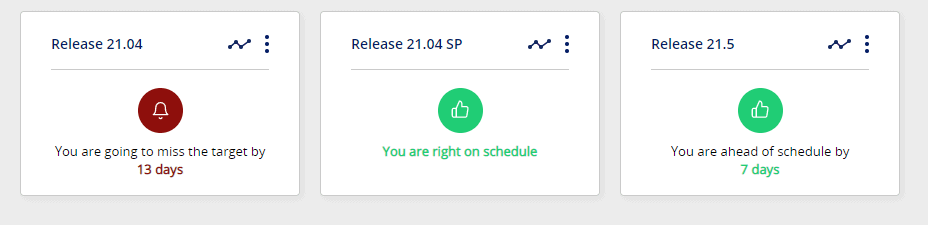
A few months ago, Panaya introduced customizable dashboards. One of the widgets you can add to your dashboard is the “Progress Forecast Widget”. It shows you the “bottom line” of the forecast report:
You can click on the widget, view the report, and use the simulator to see what is needed to complete your project on time.
Panaya is always working with you so you can complete your projects on time, in the desired quality and within cost!